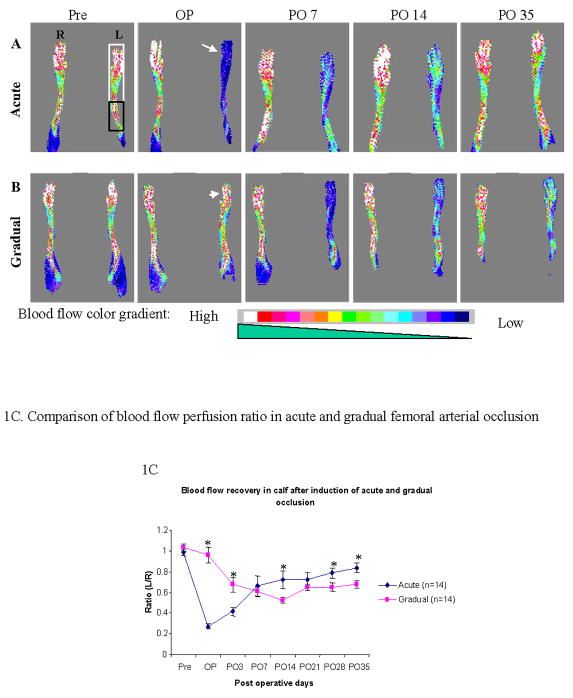
Figure 1. A–C. Laser Doppler images of blood flow in the calf and foot after induction of acute vs. gradual arterial occlusion.
Blood perfusion was monitored with LDPI at different time points: pre-operation (Pre), operation day (OP), post-operative day 7, 14 and 35 (PO 7, PO 14 and PO 35 respectively). White arrow and arrowhead indicate the blood perfusion in ischemic leg on the operation day after induction of acute (A) and gradual (B) arterial occlusion, respectively. The gradient color scale from white to dark blue indicates the blood perfusion level (high to low). White and black frame indicate the areas of foot and calf scanned by LDPI, respectively. The Y-axis of Figure 1C shows the ratio of the blood flow in the left (operated) over right (non-operated) calf muscle. The X-axis shows different time points of LDPI measurement. * Statistically significant (p < 0.05); M±SEM, n=14).

