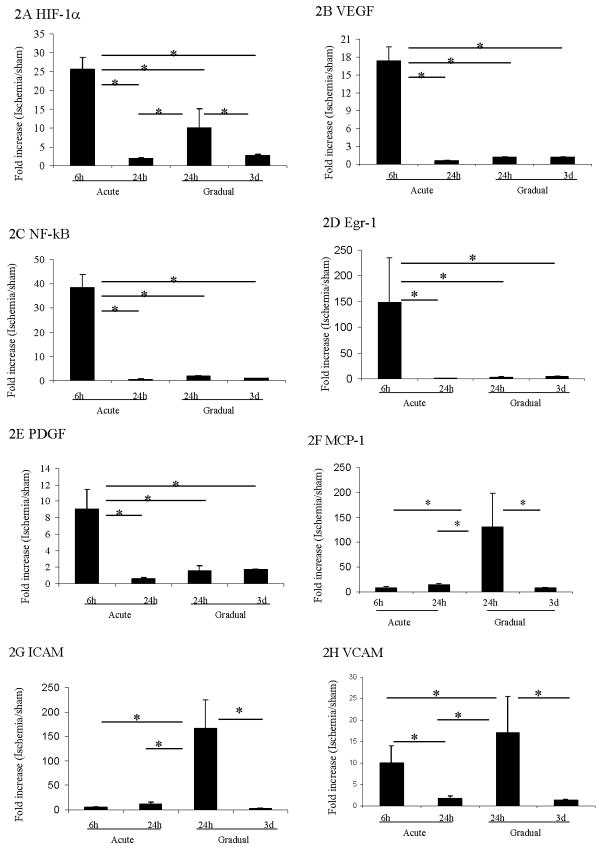
Figure 2. Gene expression in calf muscle after induction of acute or gradual arterial occlusion.
Q-RT-PCR was used to determine gene expression level of HIF-1α (A), VEGF (B), NF-κB (C), Egr-1 (D), PDGF (E), MCP-1 (F), ICAM (G), and VCAM (H) in calf muscle after induction of acute vs. gradual arterial occlusion. Gene expression values at different time points are displayed along the Y-axis as the ratio of mRNA from the left calf muscle in ischemic mouse group over mRNA from left calf in the sham control mice. * Statistically significant differences (p < 0.05) between groups were shown by linkage. The error bars represent the standard deviation in each group (n=4).

