
Figure 3. Gene expression in thigh muscle after induction of acute or gradual arterial occlusion.
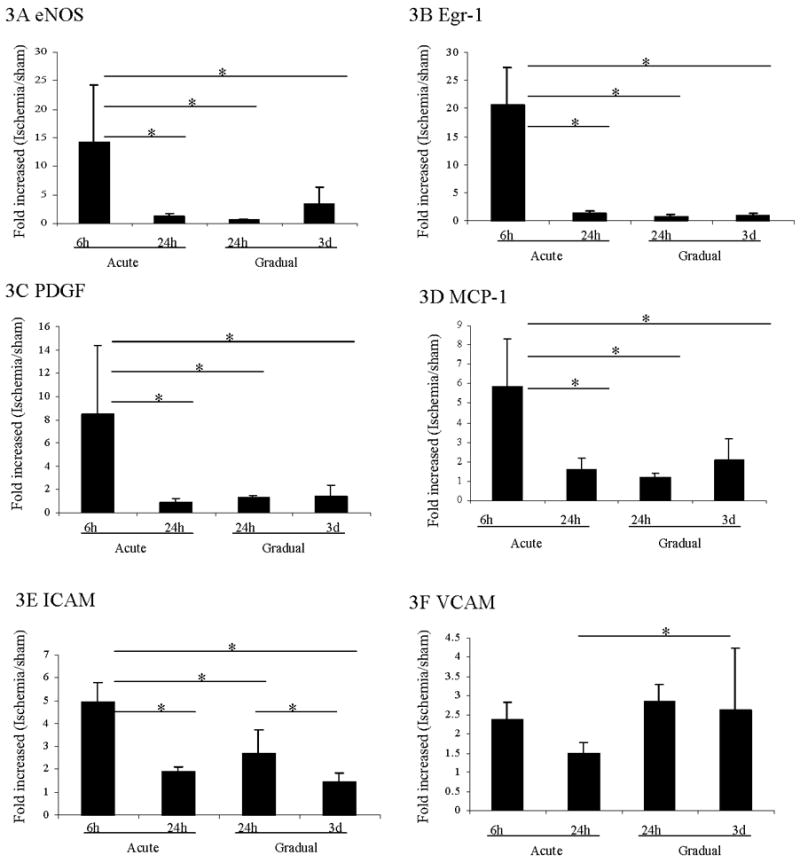
The expression of eNOS (A), Egr-1 (B), PDGF (C), MCP-1 (D), ICAM (E) and VCAM (F) in thigh muscle after induction of acute or gradual arterial occlusion was examined by Q-RT-PCR. The Y-axis shows the gene expression values expressed as the ratio of mRNA of the thigh from the side of arterial occlusion over mRNA of the thigh in sham control mice. The X-axis shows the different time points (see figure 2) in each group. * Statistically significant differences (p < 0.05) between groups were shown with linkage. The error bars represent the standard deviation in each group (n=4).