
Figure 4. Angiogenesis and arteriogenesis including angioscore and collateral diameter after acute vs. gradual occlusion.
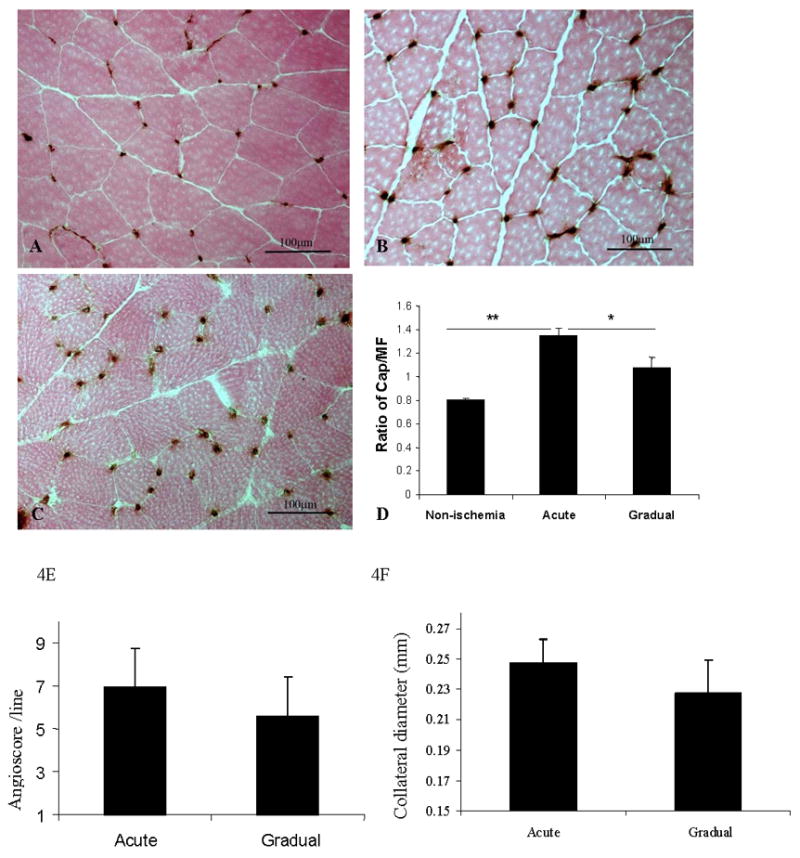
4A–4D. Capillary immunostaining (CD31) and quantitative analysis of capillary density in calf muscle on postoperative day 35.
Representative images from control (A), acute arterial occlusion (B) and gradual arterial occlusion (C) groups are shown. Capillary density, expressed by the ratio of number of capillaries over muscle fiber (Y-axis), was significantly greater in calf muscle in the acute arterial occlusion group (n=9) than in the gradual arterial occlusion group (n=7), or in normal muscle (n=4) (Figure D. ** p< 0.01 and * p<0.05.
4E–4F. Angioscore and collateral diameter in acute vs. gradual arterial occlusion.
Angiograms were performed on mice with acute vs. gradual arterial occlusion on post-operative day 35. Angioscore tended to be higher after acute arterial occlusion than after gradual arterial occlusion, although the difference between the two groups was not statistically significant (p = 0.18). (F) The diameters of the three largest collateral arteries in both the acute and gradual occlusion models were measured using Fovea Pro software. There was no statistically significant difference between the models.