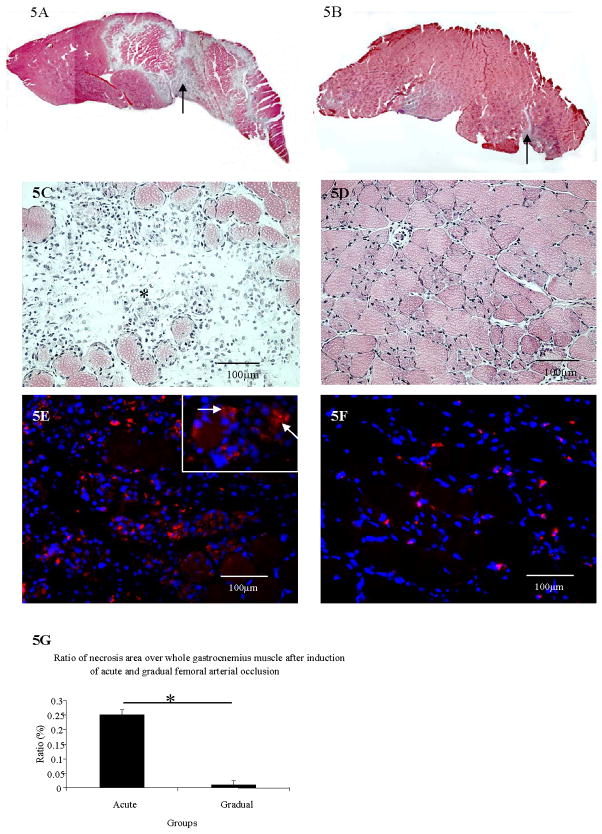
Figure 5. A–G. Muscle necrosis detection and macrophage immunostaining in gastrocnemius 3 days after acute vs. gradual arterial occlusion.
A–D, Arrows in A and B show necrotic areas after acute and gradual occlusion. C and D show the same figure of A and B at higher magnification, respectively. Star identifies the area of necrosis in C.
Figures 5E–5F, The immunostaining of macrophages (Cy3 labeled) in gastrocnemius (white arrows) after acute arterial occlusion (E) and after gradual arterial occlusion (F).

