
Table 2.
Summary of gene expression in calf and thigh muscles following induction of acute and gradual femoral arterial occlusion
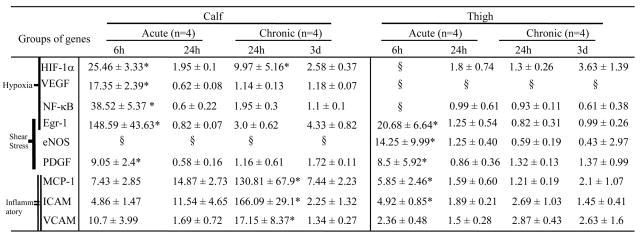 |
Values (mean ± SD) in table show the ratio (fold changed) of ischemia over sham in left hindlimb.
*
statistic significance (p < 0.05) between groups (see linkage in figures 2-3).
§
The value of mRNA did not show significant differences between ischemic side (left) and non-ischemic (right) side. Therefore the ratio of ischemia over sham was not calculated.