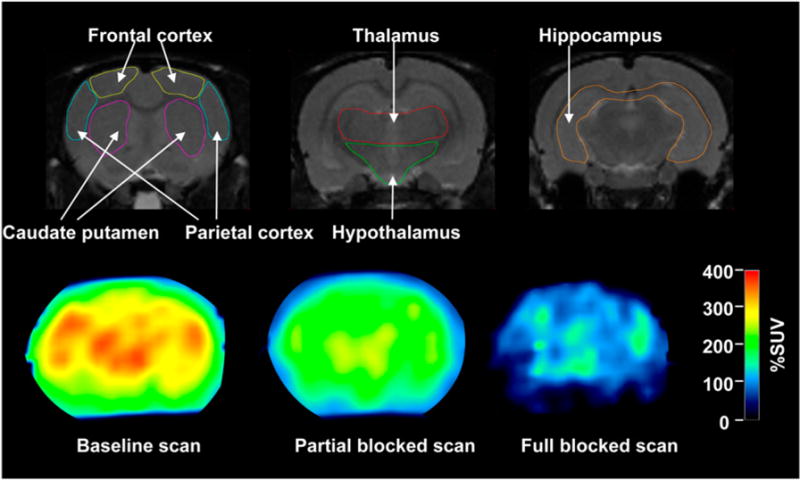
FIGURE 2.

T2-weighted MR (upper) and PET images obtained at 20–40 min (lower). MR images are displayed from rostral (left) to caudal (right) direction. 11C-(R)-rolipram PET scans were obtained at baseline (lower left), with 3.0 μg/kg dose of nonradiolabeled (R)-rolipram (lower middle), or saturating (1.0 mg/kg, lower right) dose of nonradiolabeled (R)-rolipram. PET images are in same location as middle of 3 MR images. Intensity of PET images is area under curve of radioactivity without including nonlabeled (R)-rolipram between 20 and 40 min. Value of 100% standardized uptake value (%SUV) is equal to concentration of radioligand that would be achieved if it were uniformly distributed in body.
