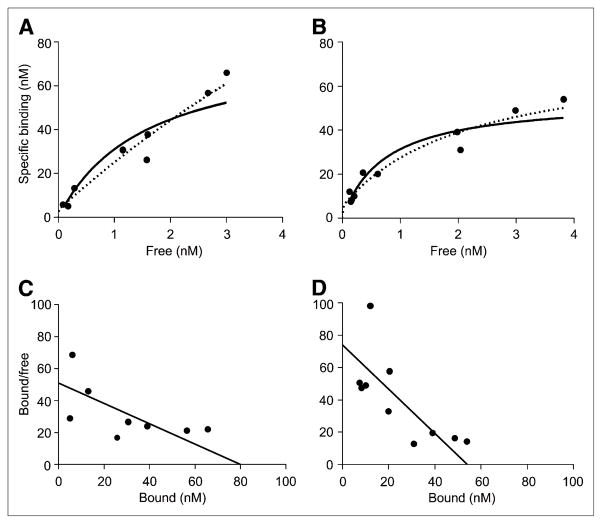
FIGURE 4.
Saturation analysis of (R)-rolipram binding measured with PET in hippocampus of conscious (A) and anesthetized (B) rats, where goodness of fit was at medium level among all regions. These graphs plot specific binding as a function of free radioligand concentration. The 1- ( ) and 2- (■■■) binding-site models did not differ based on goodness of fit in either conscious (P = 0.495) or anesthetized (P = 0.399) rats. Thus, data did not justify use of 2-site binding model. For conventional display, Scatchard plots were created using Bmax and KD obtained from non-linear fitting of 1-site model in hippocampus of conscious (C) and anesthetized (D) rats.

