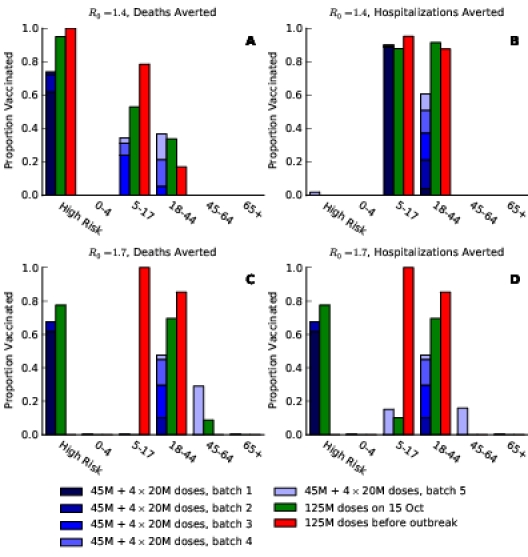
Figure 1. Optimal vaccine allocation for different vaccine delivery schedules, different values of  , and different objectives. The delivery schedule "45M + 4 × 20M doses" corresponds to five batches of vaccine delivery: 45M doses on 15 October and 20M doses each of the following four weeks. The different shades of blue correspond to the optimal allocation of the different delivery batches. The green and red bars indicate the optimal allocations under hypothetical early delivery scenarios of 125M doses on 15 October and prior to the outbreak, respectively.