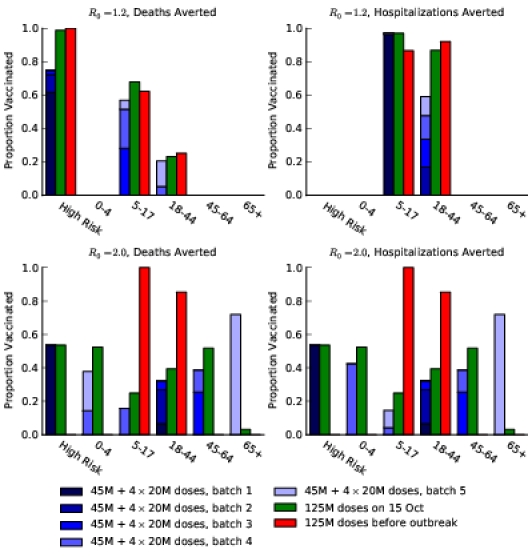
Figure S1. Optimal vaccine allocation for different vaccine delivery schedules, different values of  , and different objectives. The delivery schedule "45M + 4 20M doses'' corresponds to 5 batches of vaccine delivery: 45M doses on 15 October and 20M doses each of the following 4 weeks. The different shades of blue correspond to the optimal allocation of the different delivery batches. The graphs for
  and
and  are in the main text.