
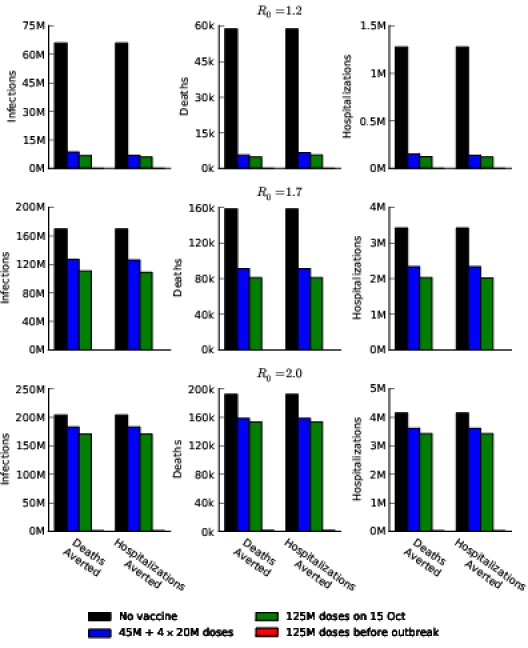
Figure S2. The impact on infections, deaths, and hospitalizations for different vaccine delivery schedules, different values of  , and different objectives. The graphs for
  are in the main text.
Official websites use .gov
A
.gov website belongs to an official
government organization in the United States.
Secure .gov websites use HTTPS
A lock (
) or https:// means you've safely
connected to the .gov website. Share sensitive
information only on official, secure websites.
Figure S2. The impact on infections, deaths, and hospitalizations for different vaccine delivery schedules, different values of , and different objectives. The graphs for are in the main text.