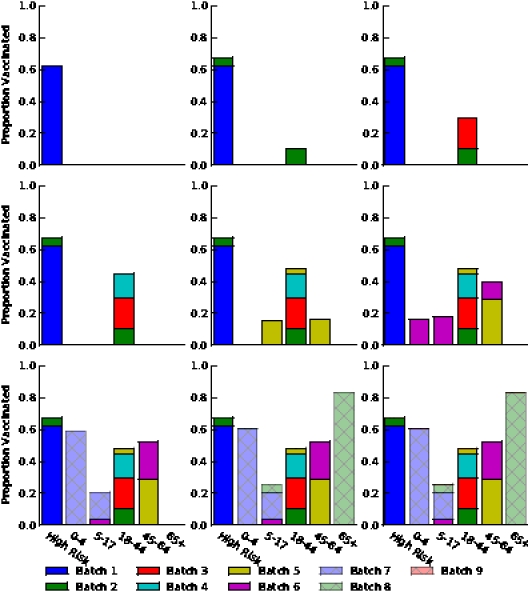
Figure S8. Optimal vaccine allocation for different numbers of vaccine batches for  and hospitalizations averted. The delivery schedules consist of from 1 to 8 batches of vaccine delivered in intervals of 1 week, with the first batch being 45M doses and subsequent batches being 20M doses. Each graph shows the optimal allocation given the number of batches of vaccine available.