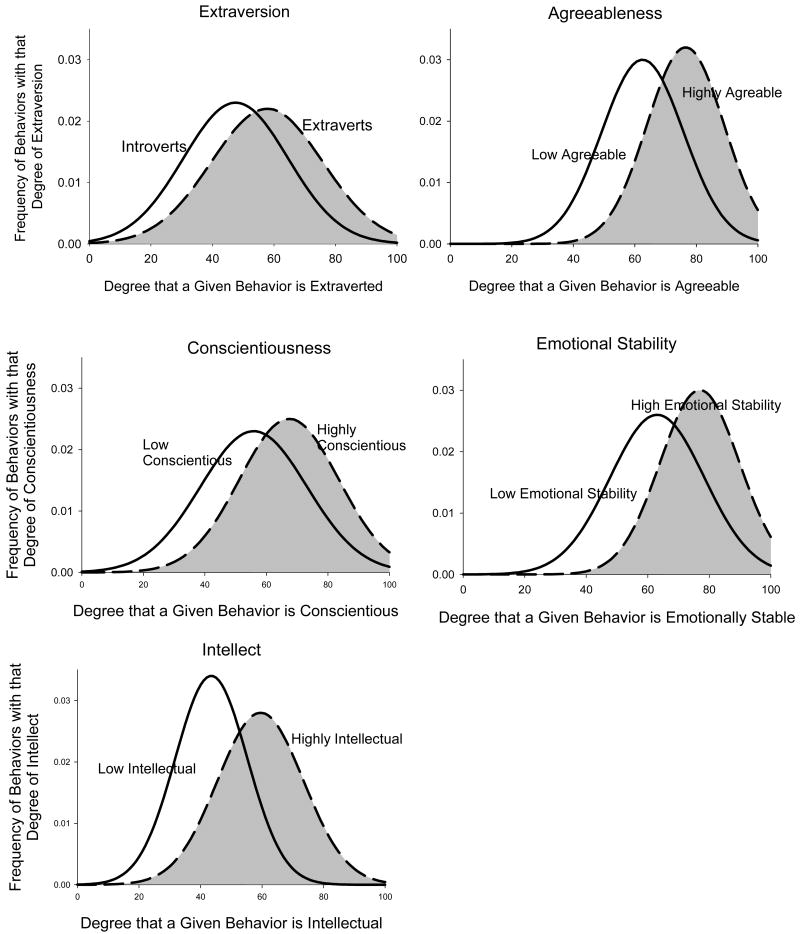
Figure 2. Distributions of actual trait-manifestation in behavior for those high and those low on a trait.
Each figure shows the density distribution of states for those one SD above and those one SD below the mean on the trait. As shown, there are reliable differences in mean behavior on the trait, but there are also large overlaps in behavior. The differences between those high and those low on a trait are not so much in non-overlapping ways of acting, nor in the extremes, but rather in the frequencies with which moderately high and moderately low behaviors for the trait are enacted.

