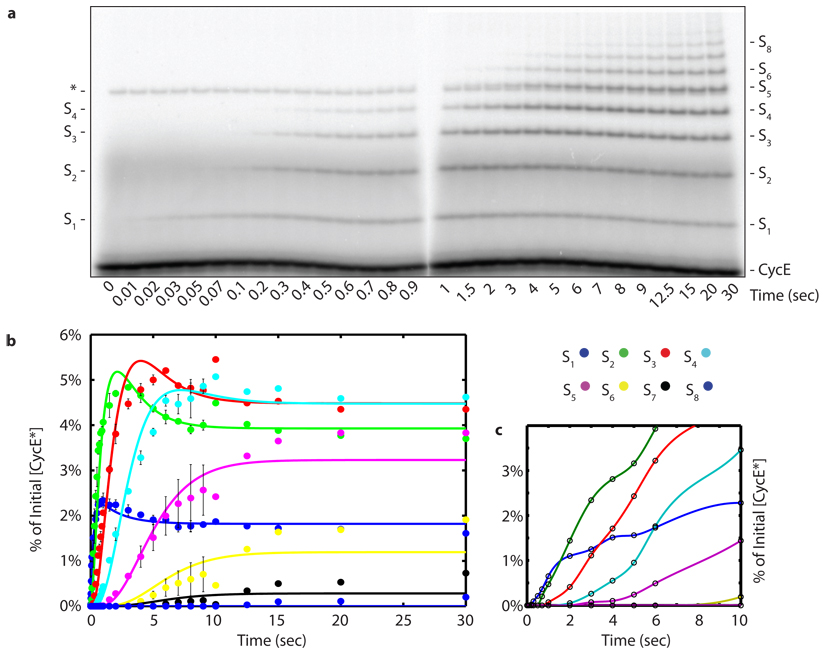
Figure 2. Millisecond kinetics of a single encounter reaction reveal sequential processivity.
a, To achieve millisecond temporal resolution CycE reactions were performed on a quench flow apparatus and products were evaluated by SDS-PAGE and phosphorimaging. The reaction scheme matched reaction 2 of Fig. 1a. The asterisk marks a contaminant. Sn refers to CycE modified with n ubiquitins. b, Quantification shows successively longer lag phases for each additional ubiquitin added in the chain. The data was fit using closed form solutions refined by global regression analysis to a model with η=1. The error bars represent the range of values, n=2.

