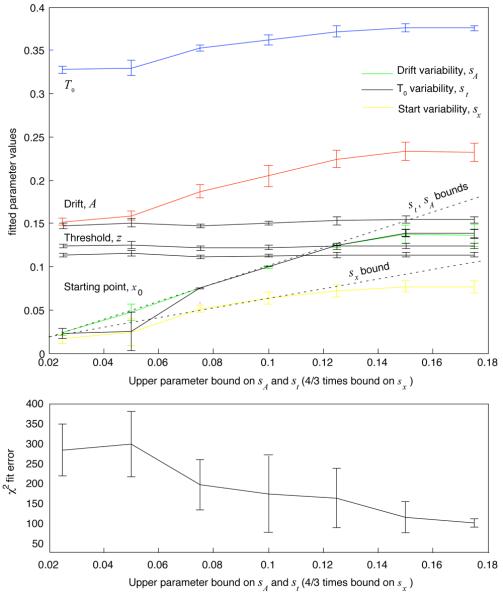
Figure 4.
Top panel: Average extended DDM parameter values from fits to 150 subsets of half the data (sampled with replacement) in each condition of Experiment 1, plotted as a function of the upper bound applied to the st and sA parameters during fitting (error bars represent the standard error of the mean). Drift A and residual latency T0 inflate as upper bounds on sA, sz and st increase, indicating a possible source of bias in parameter estimation. Bottom panel: Chi-square fit error as a function of upper bound values. Average fit-error for the bound value closest to the bounds used in our analyses was approximately 200.

