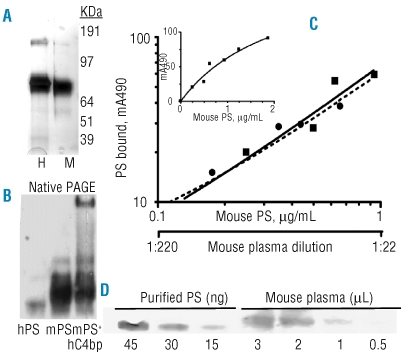
Figure 5.
Protein and antigen analysis. (A) Denaturing SDS-PAGE electrophoresis of non-reduced (2 μg) purified protein S stained with Simple Blue. H= Human plasma-derived protein S. M= Murine recombinant protein S. The faster migration of mouse protein S is due to the lack of a carbohydrate side chain at residue 489. (B) Native PAGE immunoblot using 8% Tris-glycine gel of 0.5 ng human protein S (lane 1) and 30 ng mouse protein S in the absence and presence of 300 ng human C4bp (lanes 2, 3). (C) ELISA for murine protein S. Standard dilutions of purified murine protein S were used to calculate the concentration of murine protein S in dilutions of pooled murine plasma, using a log-log plot. The plots were superimposed at dilutions of mouse plasma that indicated an initial concentration of 22 μg/mL mouse protein S. The insert shows a linear plot of extended concentrations of purified mouse protein S. (D) Quantitative immunoblot for protein S in mouse plasma, using a 4–12% Bis-Tris gel. The first three lanes show purified murine protein S (45–15 ng), mixed with 10 μg BSA/lane; the next four lanes show pooled mouse plasma (3–0.5 μL). Blots in (B) and (D) were developed with 10 μg/mL goat anti-protein S, 1 μg/mL biotin-mouse anti-goat protein S (Pierce), 1 μg/mL streptavidin-horseradish peroxidase (Pierce) and chemiluminescent detection.

