
Figure 2.
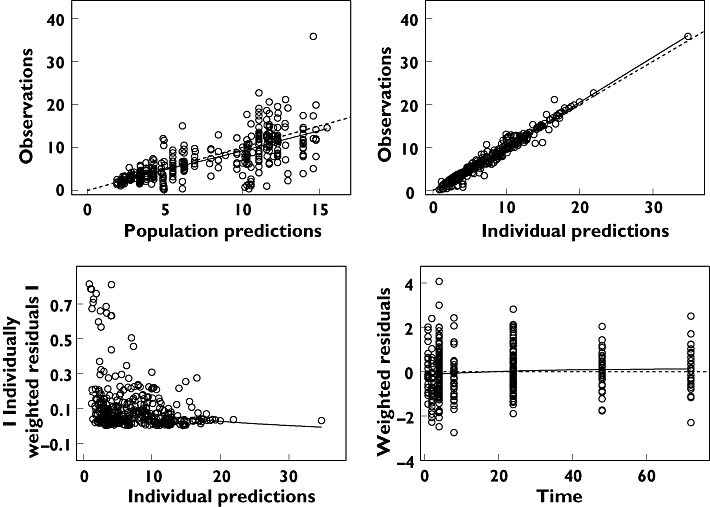
Basic goodness of fit of the final efavirenz model after a single dose in 121 healthy Ugandans. The predictions should match the observations. Residuals should be distributed evenly around the reference line over time and should not give a pronounced slope over the predicted time range. Upper left panel: the observations are plotted vs. the population predictions. Upper right panel: the observations are plotted against the individual predictions. Lower left panel: the absolute values of the individually weighted residuals are seen vs. the individual predictions. Lower right panel: the individually weighted residuals are plotted vs. time after dose. The dashed lines are the lines of identity or the zero reference lines, respectively. The solid line is a smooth nonparametric regression line