
Figure 2.
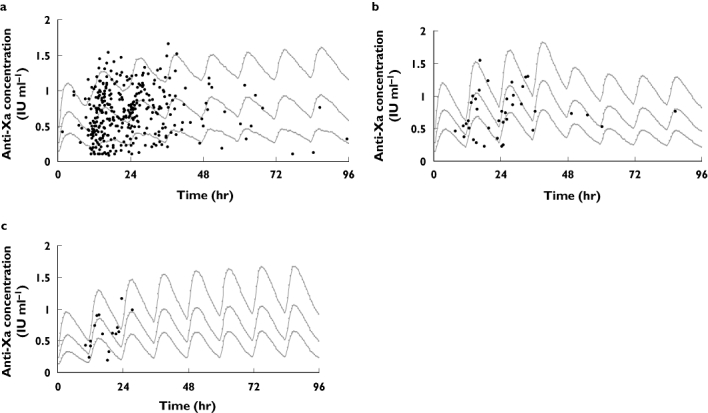
Visual predictive checks for the pharmacokinetic model. The 10th, 50th and 90th prediction intervals from the simulated concentrations are plotted against time post first dose, with the observed data superimposed. (a) All subjects. (b) Subjects with a CLCR < 50 ml min−1[considered to have renal impairment in the randomized controlled trial (RCT)]. Note that subjects in the individualized arm of the RCT that had a CLCR < 50 ml min−1 were dose reduced at 48 h of therapy based on renal function. (c) Subjects with a Wt ≥ 100 kg (considered obese in the RCT)