
Figure 3.
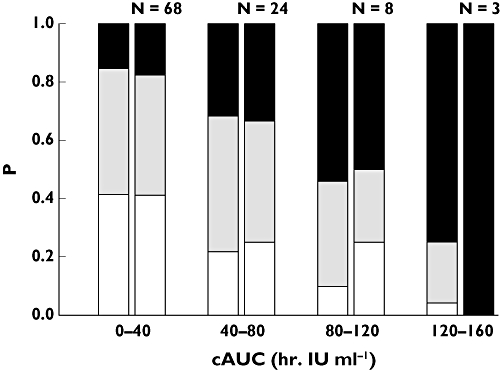
Plot of empirical (right column) and model-predicted (left column) probability (P) of event severity vs. cumulative area under the concentration–time curve (cAUC) at median age. N, number of subjects in each bin; white segment, category S1; grey segment, category S2; black segment, category S3