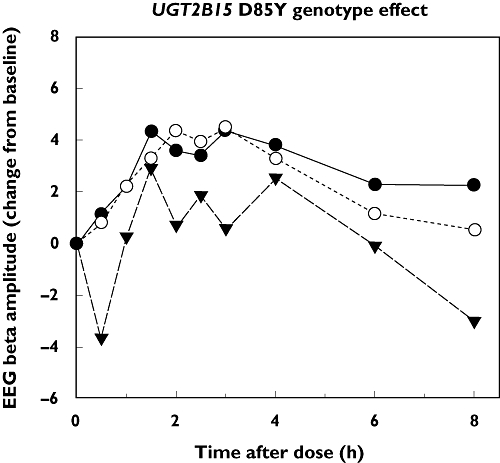
Figure 4.

Effect of UGT2B15 D85Y genotype on electroencephalogram (EEG) activity in 30 subjects administered a 15-mg oral dose of oxazepam. Plotted values represent the mean change from predose values in EEG β wave amplitude for subjects grouped by UGT2B15 85DD (n= 6), DY (n= 20) and 85YY (n= 4) genotypes. D/D ( ); D/Y (
 ); Y/Y (
 )
)
