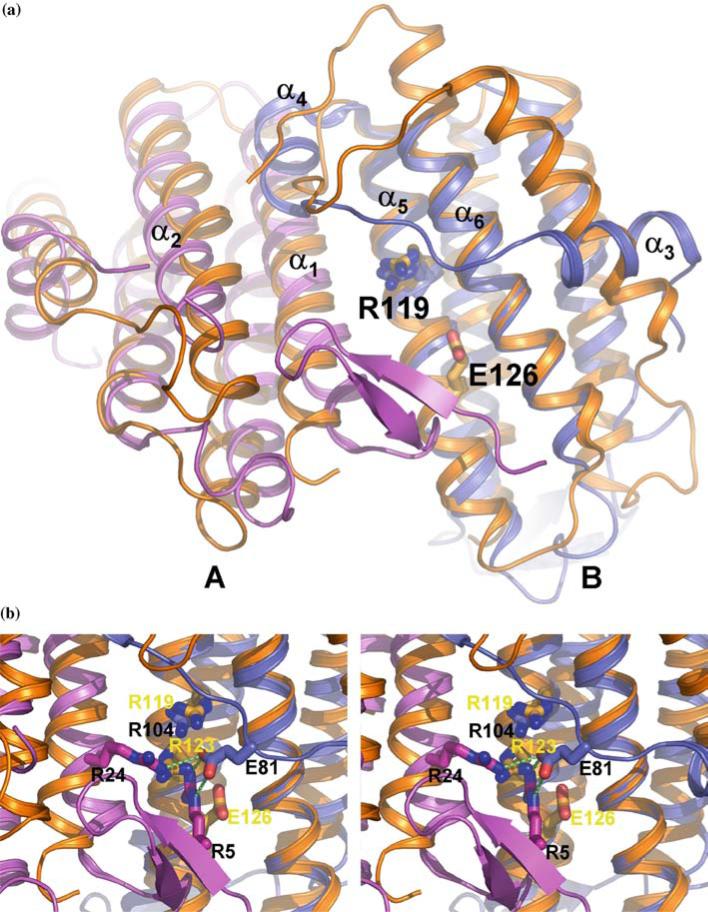
Figure 2.
Comparison of the TA1238 and TA1434 structures. (a) Two monomers of TA1238 (A, pink; B, teal) and TA1434 (orange) are shown superimposed; for clarity, the third monomer of each trimer is omitted. Arg119 and Glu126, the active site residues of TA1434, are represented by the stick models of their side chains. Arg104 of TA1238 is equivalent to Arg119 and is also shown but not labeled. Helices α5 and α6 align very well, while there is some shift in helices α1 and α2 (in TA1238 numbering) caused by the β hairpin of one monomer bumping into the N-terminal end of the other. The shifts are better seen in monomer A. The biggest differences between the two structures are in the overhand connection between helices α2 and α5. Instead of one long helix in TA1434 parallel to the four-helix bundle, there are two shorter helices in TA1238, α3 and α4. Helix α3 is almost perpendicular to its counterpart from TA1434. The rest of this segment also has different conformations in the two structures. The N-terminus in TA1434 is disordered and not seen on electron density maps, which indirectly points to a lack of β strands. Also, the configuration of this segment in TA1434 apparently does not lead to bumping of the α helices as in TA1238. (b) Close up of the presumed active site. Black labels correspond to TA1238 and yellow to TA1434. Hydrogen bonds between Glu81 from overhand connection and two arginines in the active site are shown in green dashed lines. (Figure was generated with PyMol, www.delanoscientific.com.).

