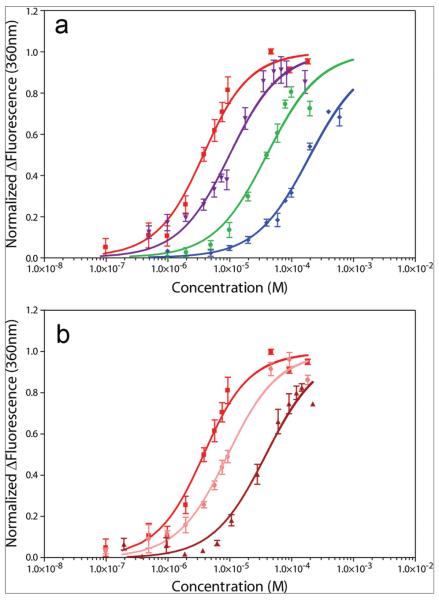
Figure 2.
Fluorescence-monitored titrations of compounds with HIV-1screen RNA. Titrations are plotted as the normalized change in fluorescence versus compound concentration. Data represent an average of 3 titrations, with the SEM indicated. a) Doxorubicin, red squares; idarubicin, violet triangles; butamben, green circles; and cinchonidine, blue diamonds. b) Representative data from doxorubicin competition titrations. Data from titrations into HIV-1screen alone, HIV-1screen in competition with 10-fold molar excess HIV-1Δbulge, and HIV-1screen in competition with 10-fold molar excess HIV-1wtbulge are shown as red squares, pink circles, and dark red triangles, respectively.

