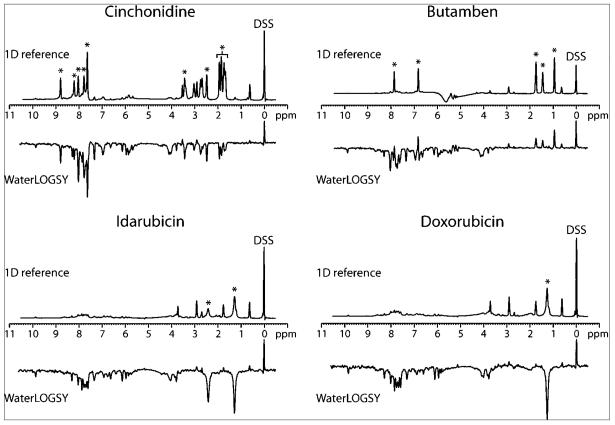
Figure 3.
NMR analysis of compound binding to RNA by WaterLOGSY. 1D reference experiments (upper spectra) and WaterLOGSY experiments (lower spectra) are grouped according to compound. The 0 ppm internal reference standard is indicated (DSS), which also serves as a control small molecule that does not bind RNA. The DSS signal is phased to be positive in both the 1D reference and the WaterLOGSY experiments. Selected peaks that are specific to each compound are indicated by asterisks.

