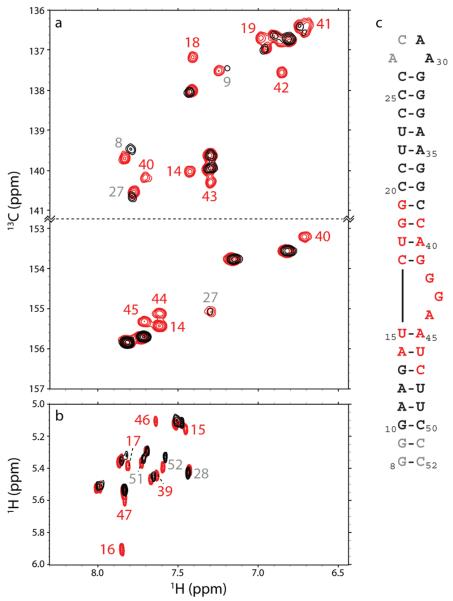
Figure 5.
Localization of doxorubicin to the HIV-18-52 RNA by NMR. Peaks are labeled by residue number, as in Figure 1, panel a. Peaks labeled in red are selectively line broadened by doxorubicin, and peaks in gray show chemical shift changes. a) Region of the TROSY-modified 2D 1H–13C HSQC spectra acquired showing the C8–H8 and C2–H2 correlations of purines. b) Region of the 2D TOCSY spectra showing the H5–H6 correlations of pyrimidines. c) HIV-1 RNA structure as in Figure 1, panel a, with residues selectively line broadened by doxorubicin indicated in red, residues experiencing chemical shift changes indicated in gray, and residues not affected shown in black.

