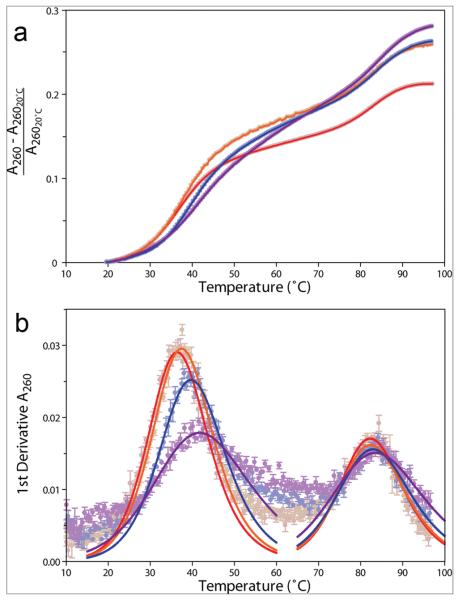
Figure 6.
UV-monitored thermal denaturation profiles for HIV-1wtbulge in the presence of varying concentration of doxorubicin. Molar ratios of doxorubicin:RNA of 0:1, 1:1, 5:1, and 10:1 are indicated as red, orange, blue, and violet circles and lines, respectively. Data points represent the average of 5 independent replicates, and error bars correspond to the SEM. a) Data are plotted as fractional hyperchromicity relative to the absorbance at 20 °C at 260 nm. Error bars have been omitted for clarity. b) First-derivative plot of data in panel a, with fitted curves showing the deconvoluted transitions as solid lines.

