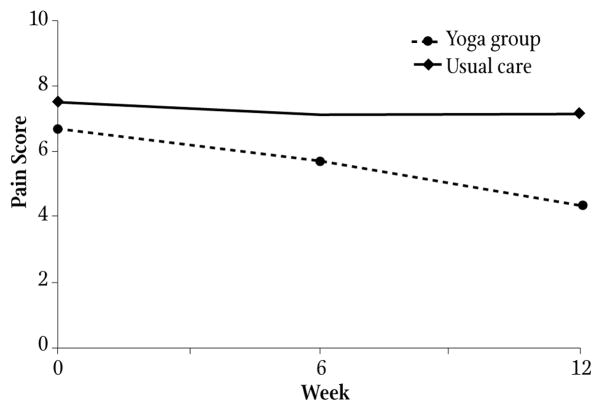
FIGURE 2.
The x-axis is time from initiation of yoga classes. The y-axis is the mean low back pain intensity in the previous week on an 11-point numerical rating scale. The yoga group received hatha yoga classes weekly for 12 weeks. Both groups received an educational book on self-care management of low back pain and continued their usual medical care. P values for any difference in mean pain scores between groups (calculated by comparing mean pain change scores from baseline using the Wilcoxon rank sum test) are .25 and .02 at 6 and 12 weeks, respectively.

