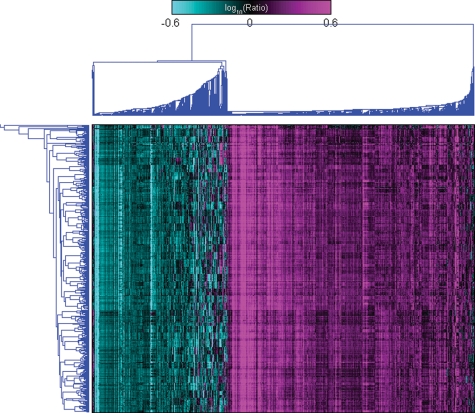
Figure 2.
Two-dimensional Hierarchical clustering. In this figure the gene expression values for the 1421 most differentially expressed genes from all 548 samples are clustered along the y-axis, and individuals are coded by color. About 542 (98.9%) of the 548 samples cluster with at least one other sample from the same individual, and for 35 (87.5%) out of 40 individuals, all samples from the particular individual cluster together. This highlights the extremely large individual specific effect seen in these data.

