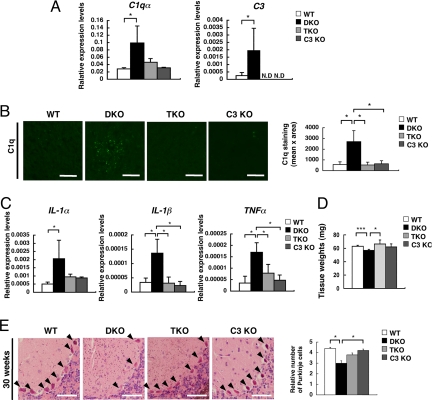
Fig. 6.
Alleviation of the complement activation, inflammation, and neurodegeneration in the DKO mice by disruption of complement C3 gene. (A) Expression levels of complement mRNAs from the cerebella of 15-week-old mice were analyzed for C1qα and C3 genes with real time RT-PCR. Relative expression levels are presented after correction by the GAPDH gene. The numbers of mice examined were: 15-week-old WT n = 5, DKO n = 4, TKO n = 3, C3 KO n = 3. (B) Deposits of C1q in the cerebella of 15-week-old WT, DKO, TKO, and C3 KO mice were analyzed with anti-C1q mAb in combination with Alexa Flour 488-conjugated anti-rat IgG. Fluorescence intensity (mean pixel × total area) of complement staining was measured by digital image analysis. Number of section area examined was: 15-week-old WT n = 6, DKO n = 6 TKO n = 6, C3 KO n = 6; data are presented as mean ± SD. The thickness of sections was 7 μm. (Scale bar, 20 μm.) (C) Expression levels of cytokine mRNAs (IL-1α, IL-1β, and TNFα) were analyzed with real time RT-PCR using RNAs from the cerebellum of individual mice. Relative expression levels are presented after correction by the mouse GAPDH gene. The number of mice examined was: 15-week-old WT n = 4, DKO n = 4, TKO n = 3, C3 KO n = 3. [Scale bar, 50 μm (A and B).] Thickness of sections, 7 μm. (D) Wet weights of the cerebella of 15-week-old WT, DKO and TKO mice as measured in Fig. 1. Numbers of tissues examined were: WT n = 6, DKO n = 5, TKO n = 3, C3 KO n = 3; data are presented as mean ± SD. (E) Cerebellar sections of 30-week-old mice stained with HE. Arrowheads indicate Purkinje cells. The numbers of Purkinje cells were counted and presented as in Fig. 1. The numbers of mice examined were: 30-week-old WT n = 2, DKO n = 2 TKO n = 2, C3 KO n = 2. Data are presented as mean ± SD. (Scale bar, 50 μm.) *, P < 0.05; ***, P < 0.001.

