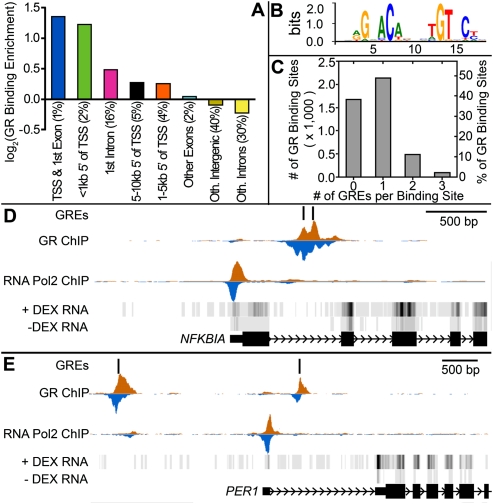
Figure 1.
Genomic distribution of glucocorticoid receptor binding sites and response elements. (A) Enrichment of GR binding sites in genomic features. The percentage of all identified GR binding sites in each type of region, indicated in parentheses, was divided by the relative amount of the human genome each type of region occupies and plotted on a log2 scale. (B) The revised glucocorticoid response element (GRE) identified in the most significant GR binding sites identified by ChIP-seq. (C) Distribution of the number of GREs in identified high-confidence GR binding sites across the human genome. (D,E) Example ChIP-seq data showing GR and Pol II (RNA Pol2) binding at GREs near the NFKBIA and PER1 genes. ChIP-seq data are plotted as the density of 25-bp tags mapping to the region. The density is separated to show reads mapping to the positive (orange) and negative (blue) strand of the reference genome. For RNA-seq data, darker indicates more expressed.

