Figure 2.
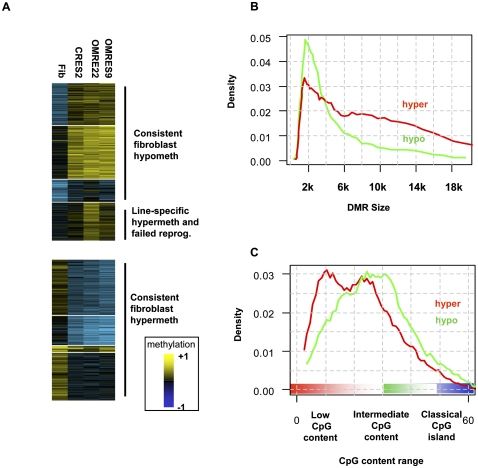
Differentially methylated regions (DMRs). (A) Global patterns of methylation reprogramming. DMRs were statistically extracted from the data by comparing methylation in all pairs of cell types, thereby not pre-assuming any type of organization. Median methylation values for each DMR over all cell types were then clustered (k-means). Shown are the color-coded methylation values of each DMR (rows), organized into clusters showing higher methylation in fibroblasts than in native stem cells (hyper-DMRs) and clusters showing lower methylation in fibroblasts than in native stem cells (hypo-DMRs). Overall, the clusters reflect different basal levels of methylation across the genome, but good correspondence between methylation in the different ES lines. An important exception is a cluster including DMRs with significantly higher methylation in ORMES-22 than in CRES-2. Some of the DMRs in this cluster may reflect ORMES-22 line-specific effects and were excluded from further analysis. Other DMRs in this cluster are also hypermethylated in the ORMES-9 line and were classified as “failed reprogramming” DMRs and analyzed separately. (B) Distribution of DMR sizes. Shown is the distribution of sizes of genomic intervals determined to be (red) hyper- and (green) hypo-DMRs. Hypo-DMRs have a more specific length distribution, peaking around 2 kb. (C) DMR CpG content. The average number of CpGs in 500-bp windows was computed for each DMR (each CpG was counted twice), and the distribution of CpG contents for hyper- and hypo-DMRs was plotted. Hyper-DMRs have a lower overall CpG content. Importantly, both types of DMRs generally occupy regions of low to medium CpG content, and are not observed in classical CpG islands (CpG content >50).

