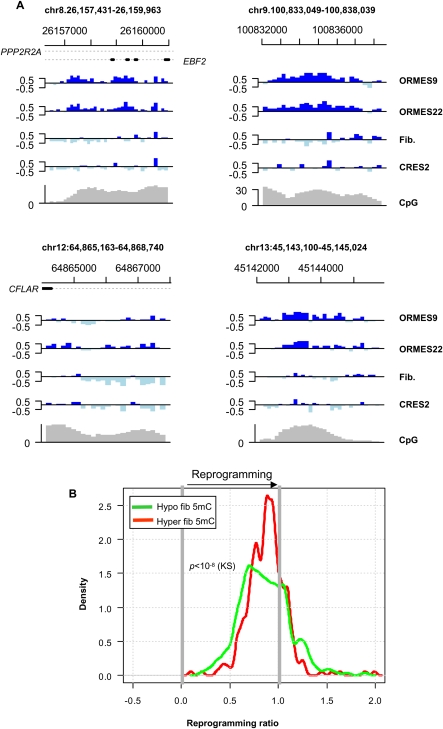
Figure 5.
Partial and failed reprogramming. (A) Failure to reprogram DMRs. Shown are examples of DMRs in which the reprogrammed ES DNA methylation pattern follows the fibroblast pattern. These stand in marked contrast to the overall genomic trend (e.g., Fig. 1) and may represent complete lack of reprogramming, partial reprogramming that could not complete, or ongoing reprogramming with much slower kinetics than the genomic trend. (B) Reprogramming ratios. Reprogramming ratios were computed as the ratio of the difference between the reprogrammed ES and fibroblast methylation medians and the difference between the native ES and fibroblast methylation medians. A ratio of 1 indicates perfect reprogramming, and a ratio of 0 represents no reprogramming. Plotted is the distribution of reprogramming ratios of hypo-DMRs and hyper-DMRs. Data are only shown for DMRs that had similar methylation levels in the two native ES lines (ORMES-22 and ORMES-9).

