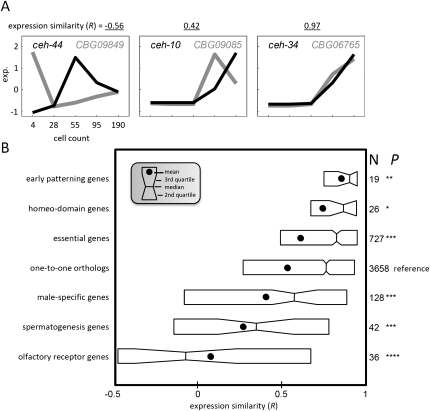
Figure 3.
Conservation of expression similarity by gene function. (A) Normalized temporal gene expression (exp) profiles for three pairs of one-to-one orthologs. For each pair, the correlation coefficient (R) is indicated. (B) Distributions of expression similarities (R) between C. elegans and C. briggsae gene profiles for six gene categories and for all of the one-to-one orthologs in boxplot format. The middle vertical, notch, circle, and left and right boxes, respectively, indicate the median, 95% confidence interval, mean, and second and third quartiles. Shown to the right is the number of genes in each category and the associated P-value with respect to the set of all orthologs (*P < 0.05; **P < 0.005; ***P < 0.0005, Kolmogorov-Smirnov test).

