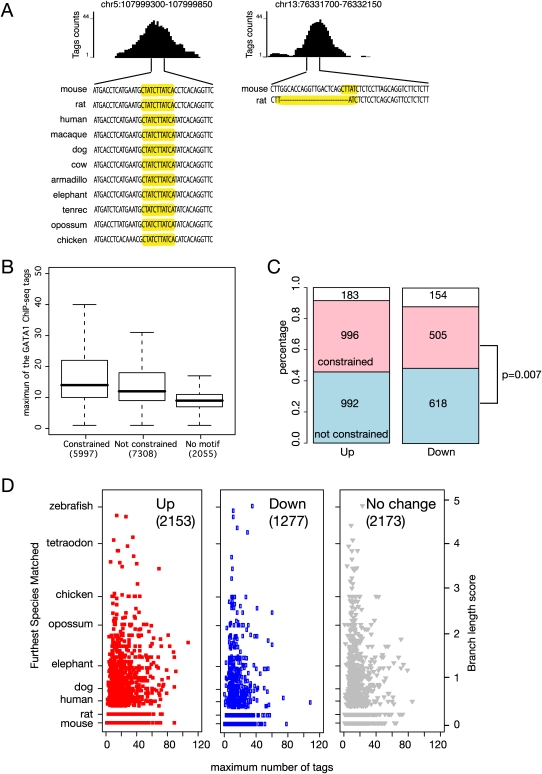
Figure 6.
Correlation of evolutionary constraint on the WGATAR binding site motif and level of occupancy and induction of target genes. (A) Examples of GATA1 OSs with equal occupancy by GATA1, with deep preservation of the WGATAR motif on the left but a rodent-specific motif on the right. (B) Boxplot comparing the distributions of occupancy level in GATA1 OSs after partitioning them by evidence of purifying selection (constraint) on the binding site motif or absence of the motif. Analyses in this figure use all GATA1 OSs in the proximal neighborhood of genes throughout the mouse genome. (C) Bar graphs presenting the percentages (y-axis) and the numbers (in each box) of GATA1 OSs in the proximal neighborhoods of up-regulated and down-regulated genes, again partitioning them by evidence of constraint (red) or not (blue) on the binding site motif. The numbers of GATA1 OSs with no WGATAR motif are given in the white boxes. The P-value is for a χ2-test on motif constraint and direction of regulation. (D) The ranges of constraint on the most deeply conserved WGATAR binding site motif in each GATA1 OS (expressed on the y-axis as the branch length score from mouse to the most distant species to which the motif is preserved) and of occupancy (expressed as the maximum number of sequence tags in the ChIP-seq data). The results are shown for GATA1 OSs in the proximal neighborhood of up-regulated, down-regulated, and nonresponsive genes. Along the left side, the branch length score is calibrated by the comparison species representing the major clades.

