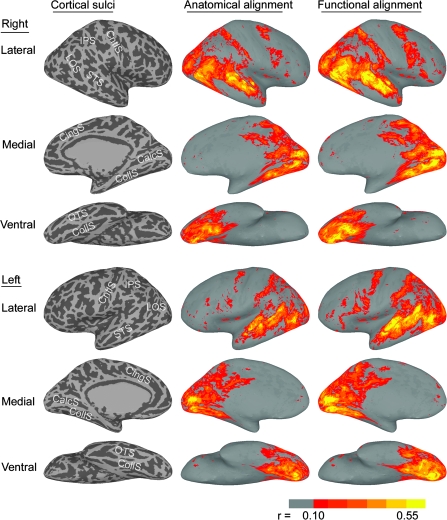
Figure 2.
Generalization to the first half of the movie. The images in the left column show the sulcal anatomy for the inflated cortical surfaces (IPS—intraparietal sulcus; LOS—lateral occipital sulcus; STS—superior temporal sulcus; CntlS—central sulcus; CingS—cingulate sulcus; CalcS—calcarine sulcus; CollS—collateral sulcus; OTS—occipitotemporal sulcus). The images in the middle column show the mean correlation of each subject with the other 9 subjects for corresponding nodes after anatomical cortical registration. The images in the right column show mean correlations after applying the warps to these nodes that maximized functional similarity in the second half of the movie (cross-validation test). The effect of applying the warps based on the first half of the movie to the data from second half of the movie was highly similar (see Supplemental Fig. S1). Correlations less than +0.10 (P < 0.01) are not shown.

