Fig. 1.
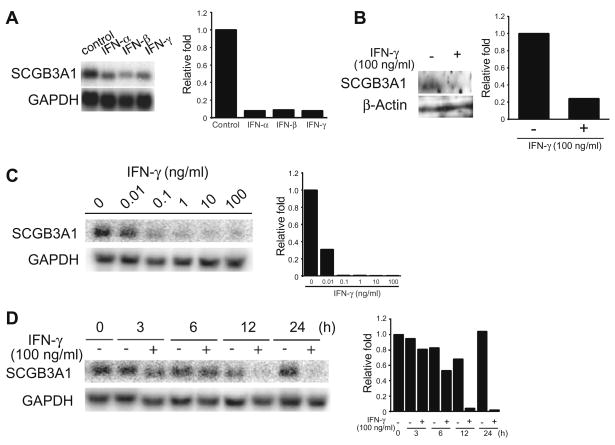
Regulation of SCGB3A1 gene expressions by IFNs. (A) mtCC cells were treated with 100 ng/ml of selected IFNs (IFN-α, IFN-β and IFN-γ) for 12 h, and mRNAs for SCGB3A1 and GAPDH as a control were examined by Northern blot analysis. (B) Effect on SCGB3A1 protein expression of IFN-γ. mtCC cells were treated with 100 ng/ml of IFN-γ, and proteins for SCGB3A1 and β-actin as a control were examined by Western blot analysis. (C) Dose effects of IFN-γ analyzed using Northern blots. mtCC cells were treated with 0.01, 0.1, 1, 10, or 100 ng/ml of IFN-γ for 24 h. (D) Time course analysis of IFN-γ effects by Northern blot analysis. mtCC cells were treated with 100 ng/ml of IFN-γ for 3, 6, 12, or 24 h. In each panel, band intensities were quantitated and the relative expression of SCGB3A1 vs GAPDH as a control is plotted on the right. Experiments were repeated at least twice and a representative result is shown.

