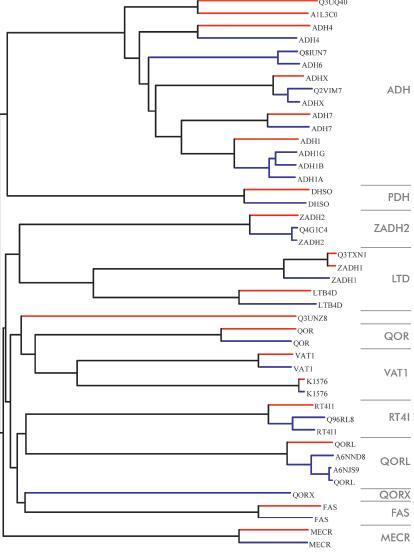
Figure 4.

Dendrogram of human and mouse MDR forms. Blue lines represent human MDRs and red lines mouse MDRs. At the right, MDR families are shown in grey. Labels show the Uniprot name excluding species designation. Tree drawn using the NJPlot program [113]. A complete tree with bootstrap values and full Uniprot identifiers is shown in Supplement Figure 3.
