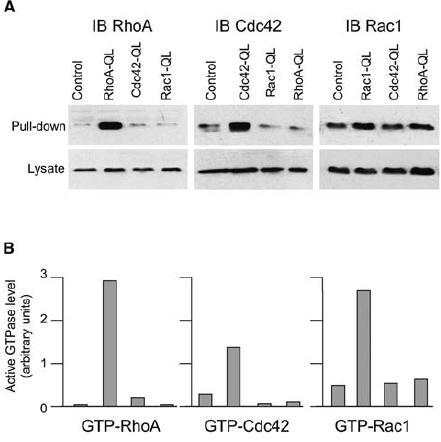
Figure 1.

Basal levels of active GTPases in RhoA-QL, Rac1-QL and Cdc42-QL fibroblasts. Cells were serum-starved for 24 h and the activity of RhoA, Rac1 and Cdc42 was measured by pull-down assays in parental mock-transfected cells (control) and in the RhoA-QL, Rac1-QL and Cdc42-QL clones as indicated in A. Signals obtained for the pull-down samples correspond to 800 µl of lysate for the blots with anti-RhoA and anti-Cdc42 and 500 µl of lysate for the blot with anti-Rac1. Aliquots of the respective lysates (40 µl) were used to analyze the total amount of each GTPase. (B) Band intensity in the blots shown in A was quantified by densitometry and the relative amounts of active GTPase were normalized to the total content of GTPase in the lysate.
