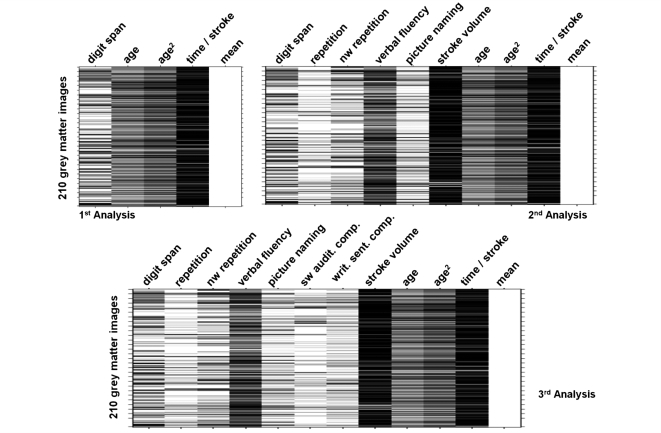
Figure 2.
The three design matrices used in the regression analyses. The 210 grey matter volumes were entered as the dependent variable or data = y. The subject-specific independent variables were entered in columns (one value for each subject). For the first analysis the only behavioural score entered was digit span (first column), along with key demographic variables (age, age2 and time since stroke); each variable was mean centred. The last column (mean) modelled the constant term of the multiregression analyses. In the second analysis four additional variables were added (repetition, verbal fluency, picture naming and stroke volume). In the third analysis two additional variables were added (spoken single word comprehension, written sentence comprehension). The order the variables were entered into the design matrix had no effect on how the residual variance was modelled.

