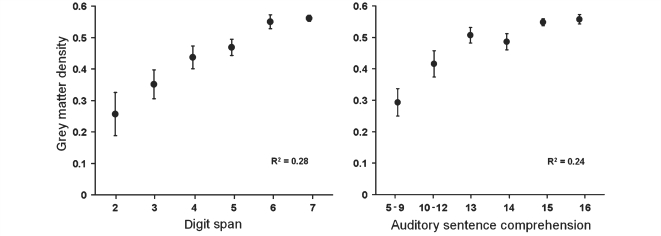
Figure 4.
Means (with SEM error bars) of grey matter density plotted against scores of digit span (left panel) and spoken sentence comprehension (right panel) for the 210 patients. Grey matter density values were taken from the principal eigenvariate (i.e. a summary of values) of the cluster identified by the second analysis as supporting auditory short-term memory (MNI co-ordinates: –66 –32 4). Statistical analyses were performed on all 210 data points.

