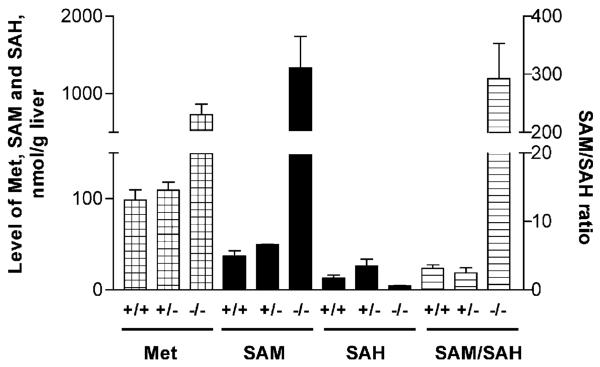
Figure 2.
Levels of methionine, SAM, SAH and ratio of SAM/SAH in mouse livers. Levels of methionine, SAM and SAH were determined in the crude extracts prepared from livers of WT, gnmt+/− and gnmt−/− mice and normalized to weight of the liver. The number of animals in each group was 4. In each case the values for the −/− group were significantly different from the other two groups but the +/− group was not significantly different from the +/+ group. Error bars indicate the S.E.M.

