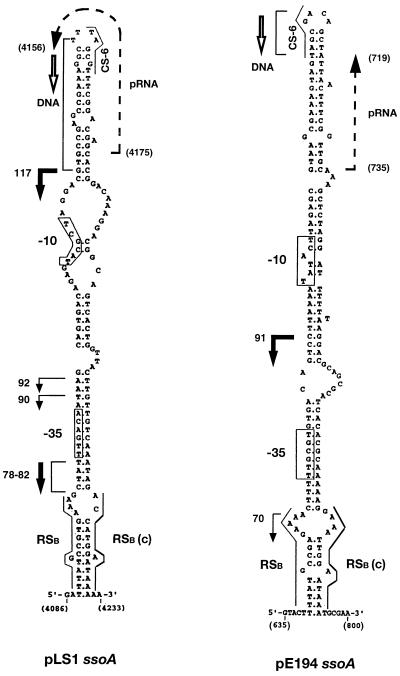
Figure 1.
Proposed structures of the pLS1 and pE194 ssoAs. Possible −35 and −10 regions are boxed. The conserved RSB, its complement, RSB (c), and CS-6 sequences also are indicated. The initiation and termination sites (positions 735–719 in pE194 and 4175–4156 in pLS1) and direction of primer RNA (pRNA) synthesis are indicated by broken arrows. The initiation points of DNA synthesis (RNA–DNA transition points), mapped in vitro in Fig. 4A and ref. 12, are indicated by brackets and direction of DNA synthesis is indicated by open arrows. Initiation sites of lagging strand synthesis mapped in vivo are shown by bold arrows (major sites) or arrows (minor sites), and the numbers correspond to the size of bands in nt shown in Fig. 4B. Nucleotide coordinates of the plasmids are shown in brackets.

