
Fig. 3.
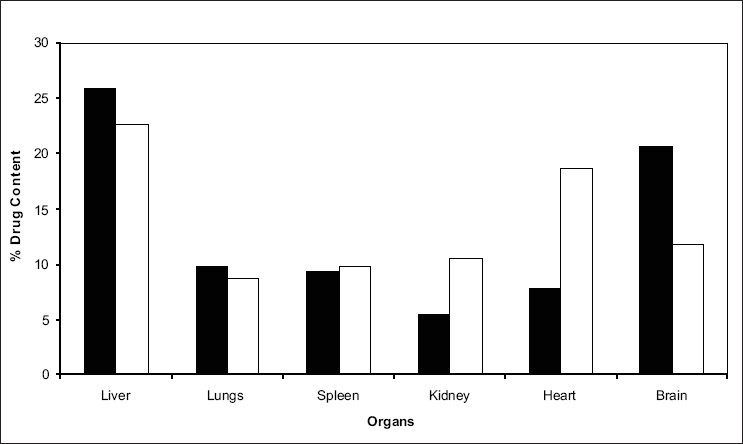
Comparison between amounts of drug distributed from formulation F3 after i.v. administration.
Optimized formulation F3 is denoted by (■) and pure drug is denoted by (□).
Official websites use .gov
A
.gov website belongs to an official
government organization in the United States.
Secure .gov websites use HTTPS
A lock (
) or https:// means you've safely
connected to the .gov website. Share sensitive
information only on official, secure websites.
Comparison between amounts of drug distributed from formulation F3 after i.v. administration.
Optimized formulation F3 is denoted by (■) and pure drug is denoted by (□).