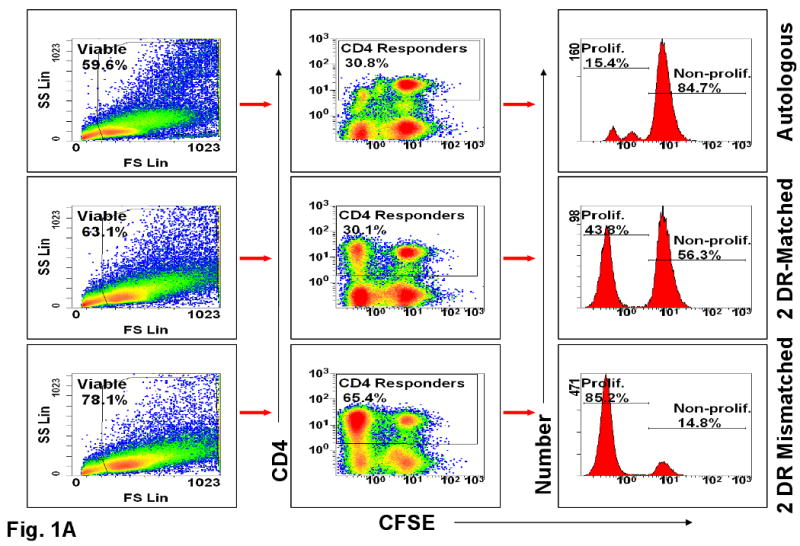
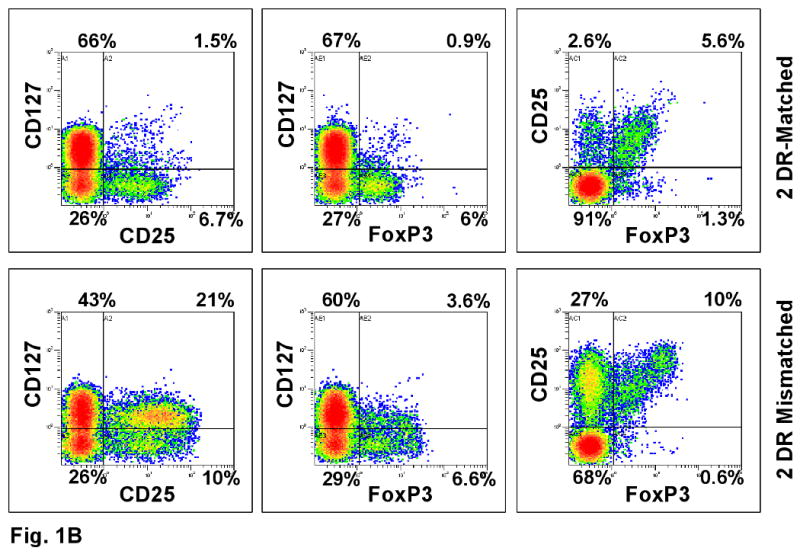
Figure 1. Scheme of flow analysis of a representative experiment (day 7 shown here).


(A) Viable cells were gated again on CD4+ cells that were either non-proliferating (CFSE high cells labeled as Non-Prolif.) or proliferating (CFSE low cells labeled as Prolif.). Cells were analyzed by dot blots and histograms. CFSE negative stimulator cells were gated out. The percentages inside the boxes of the middle column represent gated fractions of cells in each culture. (B) The gated CD4 responder cells from DR-identical vs. 2 DR mismatched MLR cultures were further analyzed for their CD127, CD25 and FOXP3 expressions. Note the lower CD127 values in the 2 DR matched pairs expressing either CD25 or FOXP3 (right upper quadrant).
