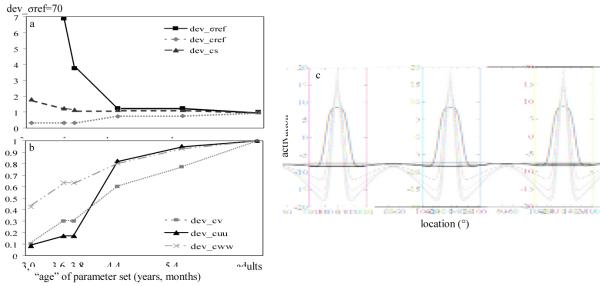
Figure 13.
Panels (a) and (b) show the developmental scaling parameters used in Experiment 3 for each age group modeled. Note that dev_σref was set to 70 for the youngest 3-year-old model (3,0). Panel (c) shows developmental changes in the activation profile of self-sustaining peaks in the SWM field as a result of changes in spatial precision parameters from early in development (black bold line) to later in development (light gray bold line).

