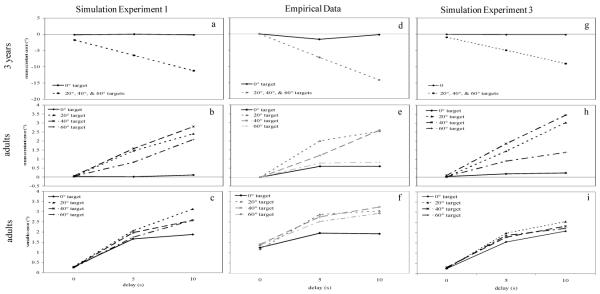
Figure 5.
Panels on the left show simulation results for Experiment 1 including (a) mean constant error over delays for parameter set 1, the 3-year-old model, (b) mean constant error over delays for parameter set 8, the adult model, and (c) standard deviation over delays for the adult model. Panels in the center show mean constant error for (d) 3-year-old children from Schutte and Spencer (2002) and (e) adults from Spencer and Hund (2002). Panel (f) shows standard deviations (variable error) for the adults from Spencer and Hund (2002). Panels on the right show mean constant error over delay for Experiment 3 for (g) parameter set 1, the 3-year-old model, and (h) parameter set 6, the adult model, and (i) standard deviations over delay for parameter set 6.

