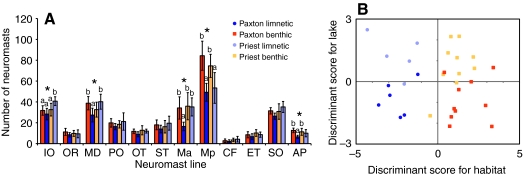
Fig. 6.
Parallel differences in lateral line phenotypes between benthic–limnetic pairs. In both panels, the Paxton populations are represented in saturated colors, with benthic sticklebacks shown as orange squares and limnetic sticklebacks as blue circles; the Priest populations are represented with pastel colors, with benthic sticklebacks shown as yellow squares and limnetic sticklebacks as purple circles. (A) Differences in neuromast number between sympatric benthic and limnetic populations in Paxton and Priest Lakes. The total number of neuromasts is plotted for each line. Error bars indicate ± s.d. Asterisks indicate lines that differ between populations labeled as ‘a’ and ‘b’ (P<0.05). (B) Discriminant Function Analysis of benthic and limnetic lateral line phenotypes in Paxton and Priest Lakes. Discriminant scores for habitat are plotted on the x-axis and discriminant scores for lake are plotted on the y-axis. Each symbol represents an individual stickleback.

