
Figure 2.
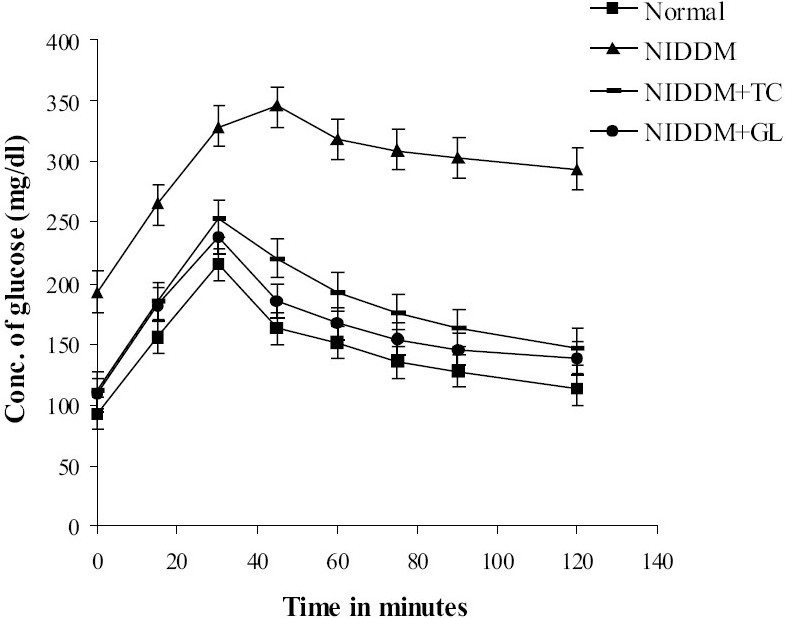
Oral Glucose Tolerance Test curves of Normal, NIDDM control, NIDDM treated with Trichosanthes cucumerina (NIDDM+TC) and NIDDM treated with Glibenclamide (NIDDM+GL) groups; n=6; **P<0.01 compared to NIDDM control; F=851.98; df=3, 20 (One-way ANOVA followed by Dunnett multiple comparison test)