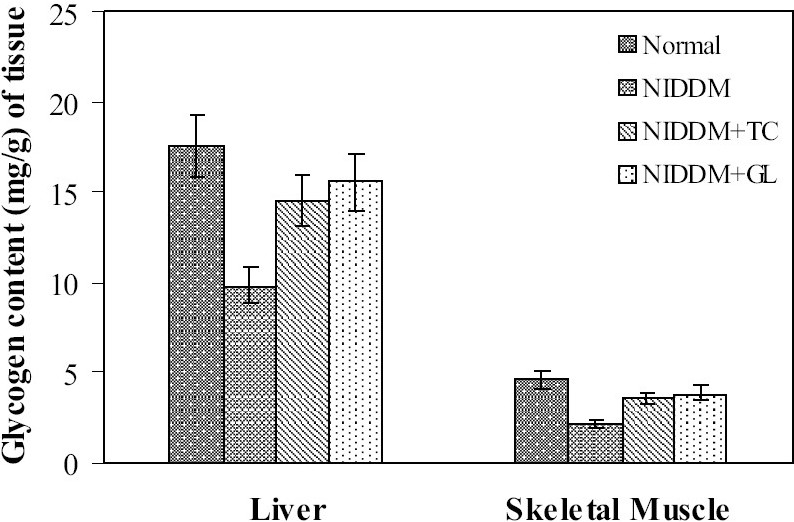
Figure 3.

Effect of Trichosanthes cucumerina on glycogen content of liver and skeletal muscle. Values are mean ± SEM; n=6; **P<0.01 as compared to NIDDM control; Liver: F=85.63, df= 3, 20; Skeletal Muscle: F=24.62, df=3, 20 (One-way ANOVA followed by Dunnett multiple comparison test); TC: Trichosanthes cucumerina; GL: Glibenclamide
