Figure 1.
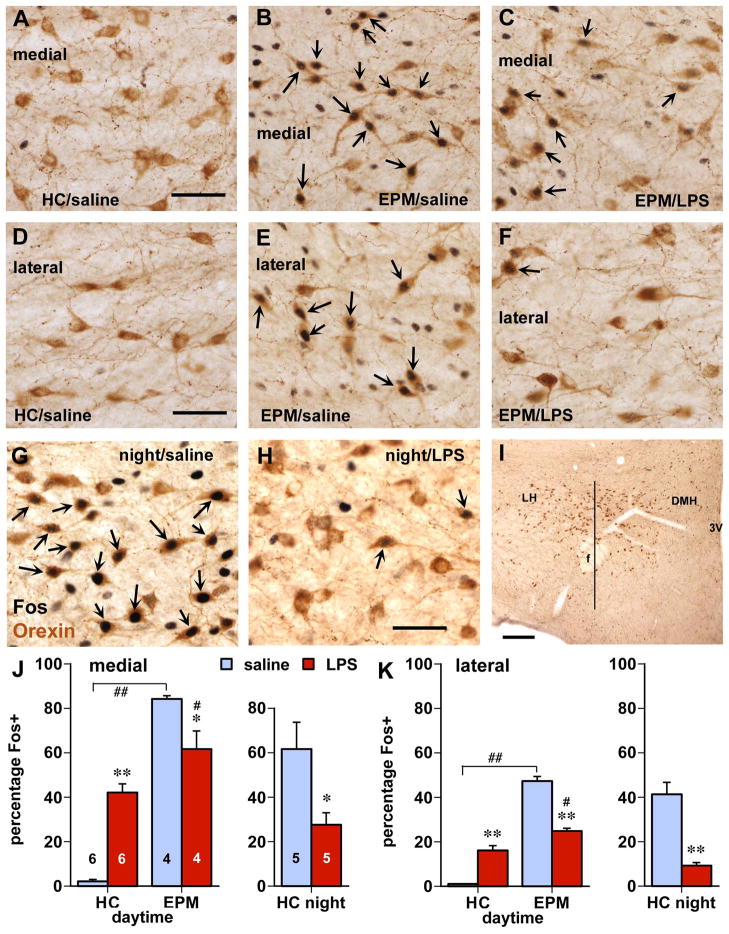
Behavior-related Fos expression in orexin neurons is inhibited by LPS treatment. Panels A–F depict orexin cells (brown cytoplasmic staining) in medial (A–C) and lateral (D–F) parts of the hypothalamus. Whereas daytime home cage controls (HC) lack Fos in these cells (A,D), elevated plus maze (EPM) testing greatly increased Fos staining (B,E; black nuclear staining, arrows indicate double-labeled neurons). After LPS injection however, Fos expression was reduced in similarly environmentally stimulated, animals (C,F). G,H: Orexin cells express abundant Fos associated which nighttime (natural) wakefulness and behavioral activity in the home cage (G), which is greatly reduced following LPS treatment (H). I: Lower magnification photomicrograph depicting the distribution of orexin neurons in the lateral (LH) and dorsomedial (DMH) regions with superimposed a vertical line through the center of the fornix (f) used to divide the cell population for quantitative analysis. Scale bars in A, D, G: 50 μm; in I: 250 μm. J,K: Quantitative analysis of the influence of involuntary (EPM) and natural environmental (night period) behavioral stimulation on expression of Fos protein in orexin cells and the effect of LPS challenge. Data are expressed in the percentage of orexin cells that were Fos-positive in medial (J) and lateral (K) populations as divided by a vertical line through the fornix (I). Numbers in J indicate group size (also apply to K); * p < 0.05, ** p < 0.0005 LPS vs. saline; # p< ˜5, # p < 0.05; ## p< ˜5: EPM vs. home cage.

