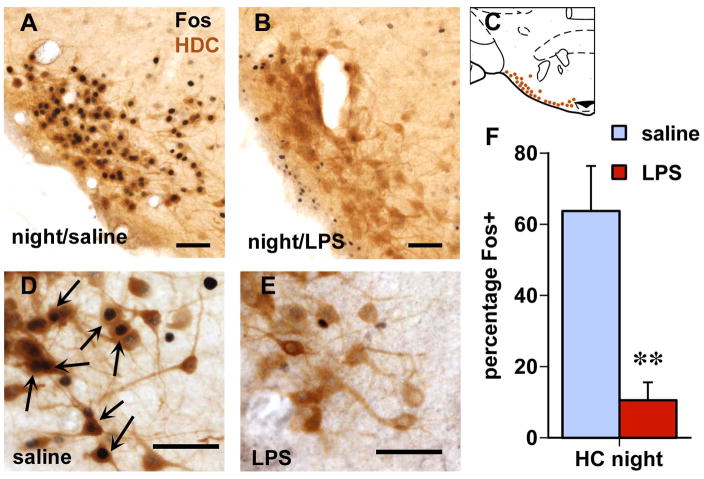
Figure 2.
Histaminergic neurons (brown staining for histidine decarboxylase (HDC) immunoreactivity show abundant staining for Fos (black cell nuclei) when rats were sacrificed 2 h into the dark period (A, with larger magnification in D; arrows point at double-labeled cells), which is strongly suppressed in LPS-injected rats (B,E). Scale bars: 50 μm. Brain diagram in C (modified after Paxinos and Watson, 1998) depicts the location of HDC-ir neurons in the tuberomammillary nucleus at the base of the posterior hypothalamus. Bar graph in F depicts the percentage of HDC neurons that are Fos-positive in each group (average and SEM; **, n = 5/group; p < 0.005 compared to saline).

